
Shopify
E-commerce Website Project
Project overview
What this engagement covered
- Client
- Health and wellness e-commerce brand (name withheld)
- Industry
- Health and Wellness
- Services
- Marketing strategy, Meta Ads, Google Ads, Ad creative production, Website fixes
- Engagement duration
- [Add Engagement Duration]
The challenge
The store was live but barely selling. In the month before the engagement, sales were close to zero. The existing marketing approach was not producing orders and the website itself had issues standing between visitors and checkout.
Objectives
- Replace the marketing approach with channels that could produce orders now
- Rebuild the creative and content the ads would run on
- Fix the website issues suppressing conversion
Strategy
The approach we took
A combined turnaround rather than a single channel fix. We moved the budget to Meta and Google Ads, produced new ad creatives and product imagery to run on them, revised the on-site content those ads landed on, and repaired the website issues found along the way. Each part supported the others: better creatives earned the click, a working site converted it.
Work completed
- Marketing strategy reset centred on Meta and Google Ads
- New ad creatives and product imagery
- Revised on-site content and product presentation
- Website issue fixes across the store
- Campaign build, launch and daily management on both platforms
Results
What the engagement produced
Each row records the measure, the period it covers and the source it can be checked against. Where a baseline existed it is shown; where one did not, the figure is stated on its own rather than as a percentage against near zero.
| Measure | Result | Period | Source |
|---|---|---|---|
| Gross sales | $120,671Pending | 30 days, 10 October to 9 November 2025 | Shopify analytics |
| Orders | 447 placed, 443 fulfilledPending | Same 30 day window | Shopify analytics |
| Returning customer rate | 11.99%Pending | Same 30 day window | Shopify analytics |
Pending final verification. These figures come from client reporting and are being reconciled against the source exports shown below before we present them as confirmed. The marker clears once that check is complete.
Evidence
Where these figures come from
Approved screenshots and reports. Account identifiers, spend figures and client names are cropped or blurred before anything is published.
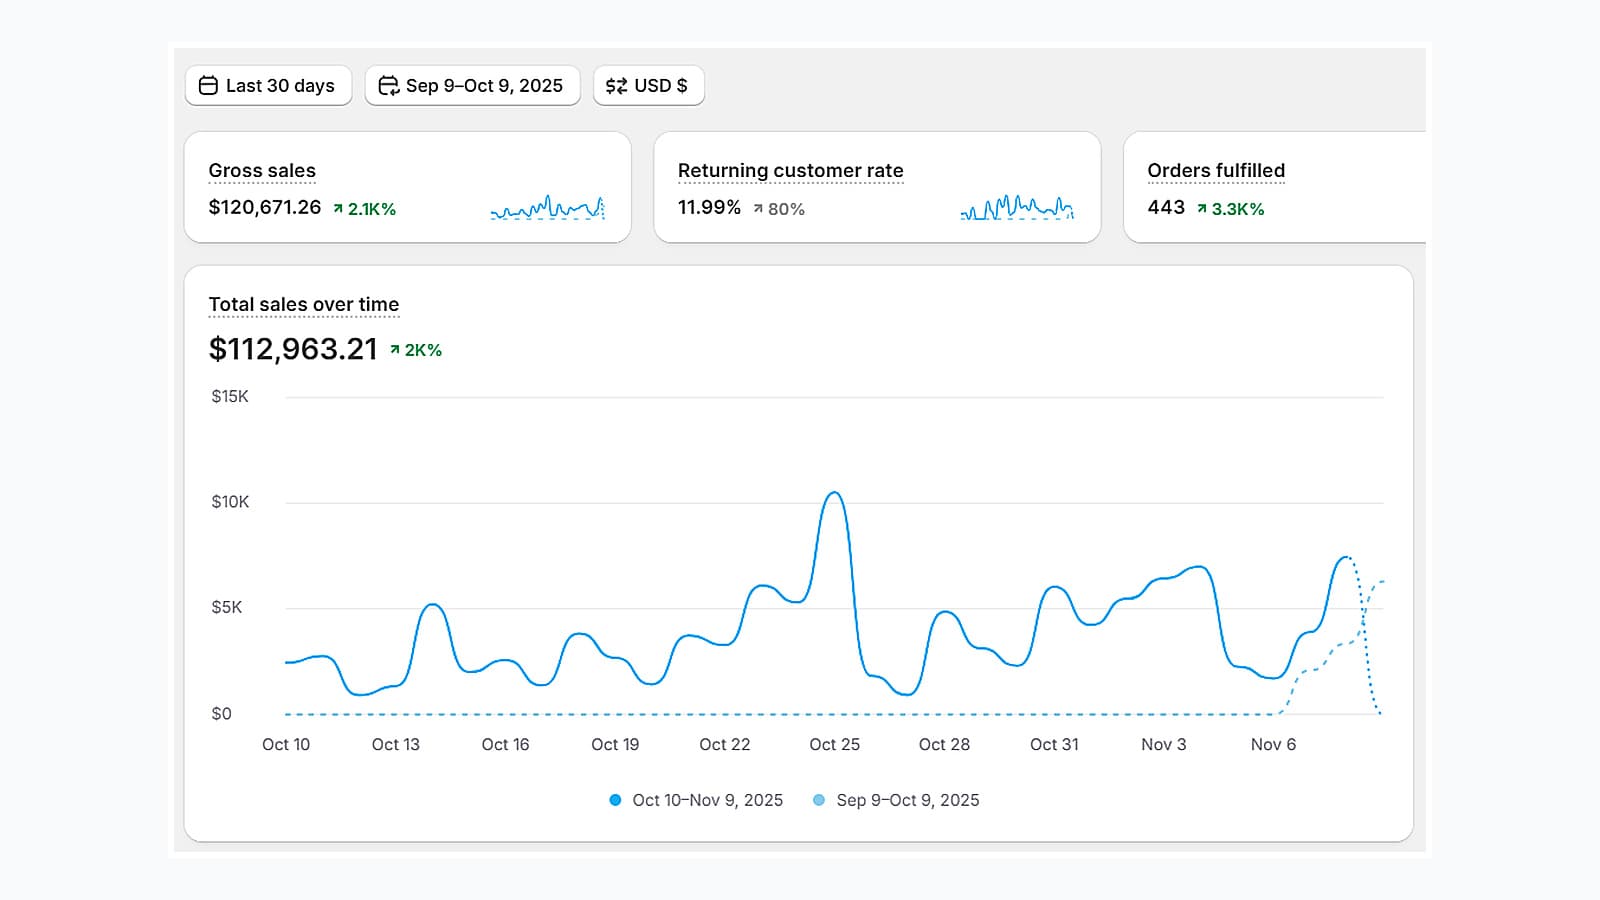
Sales over 30 days
Gross sales for the measurement window.
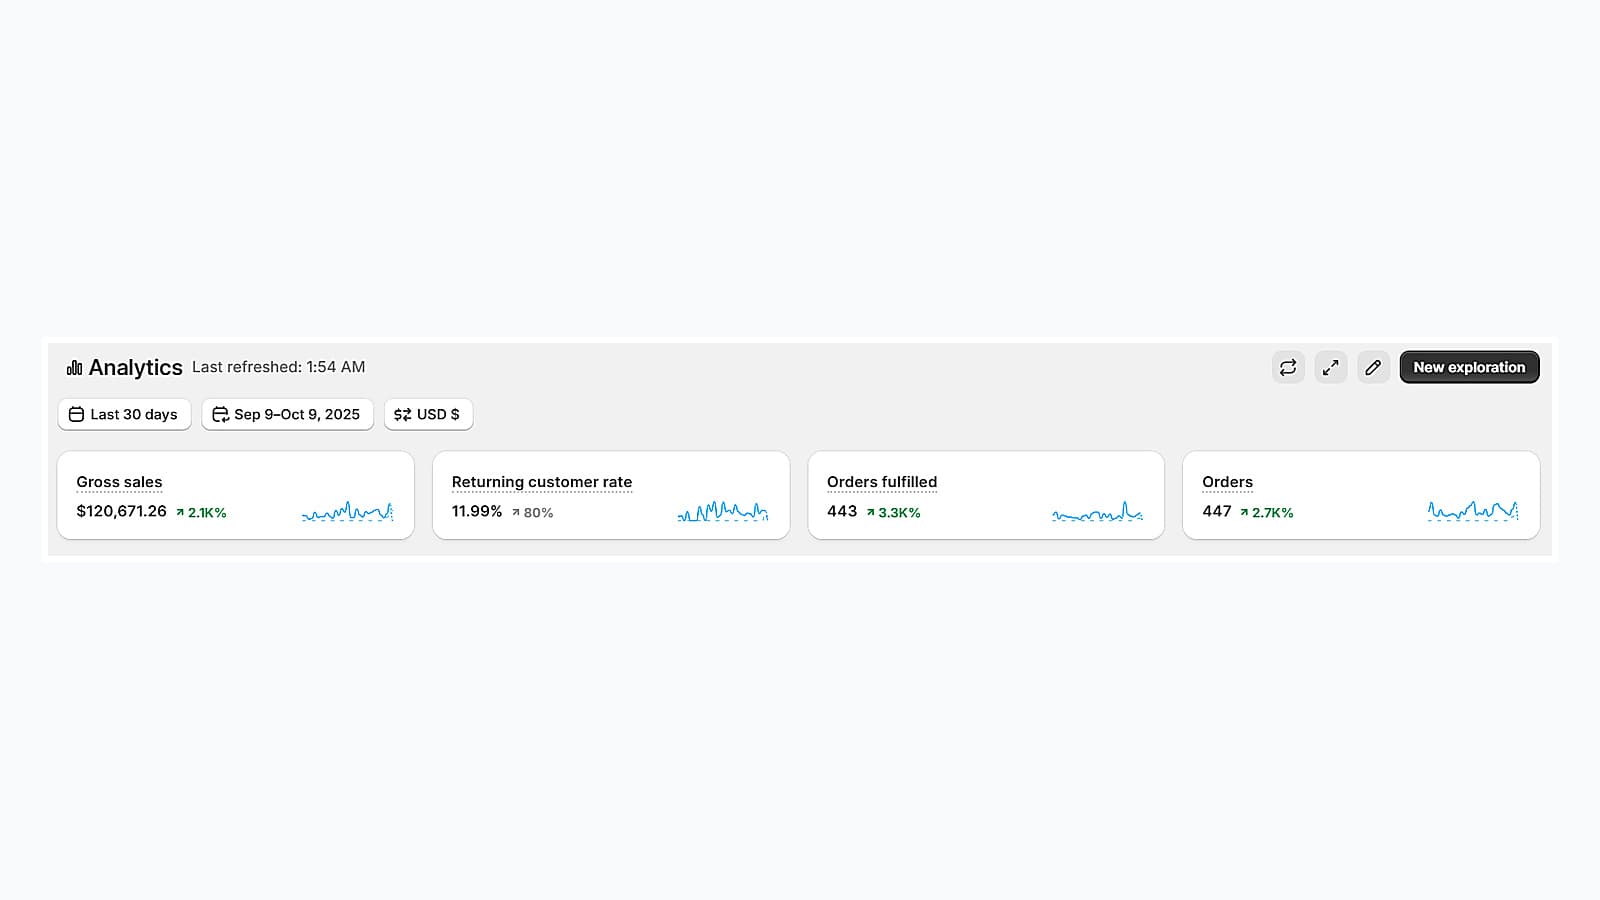
Store performance metrics
Orders placed and fulfilled, and returning customer rate.
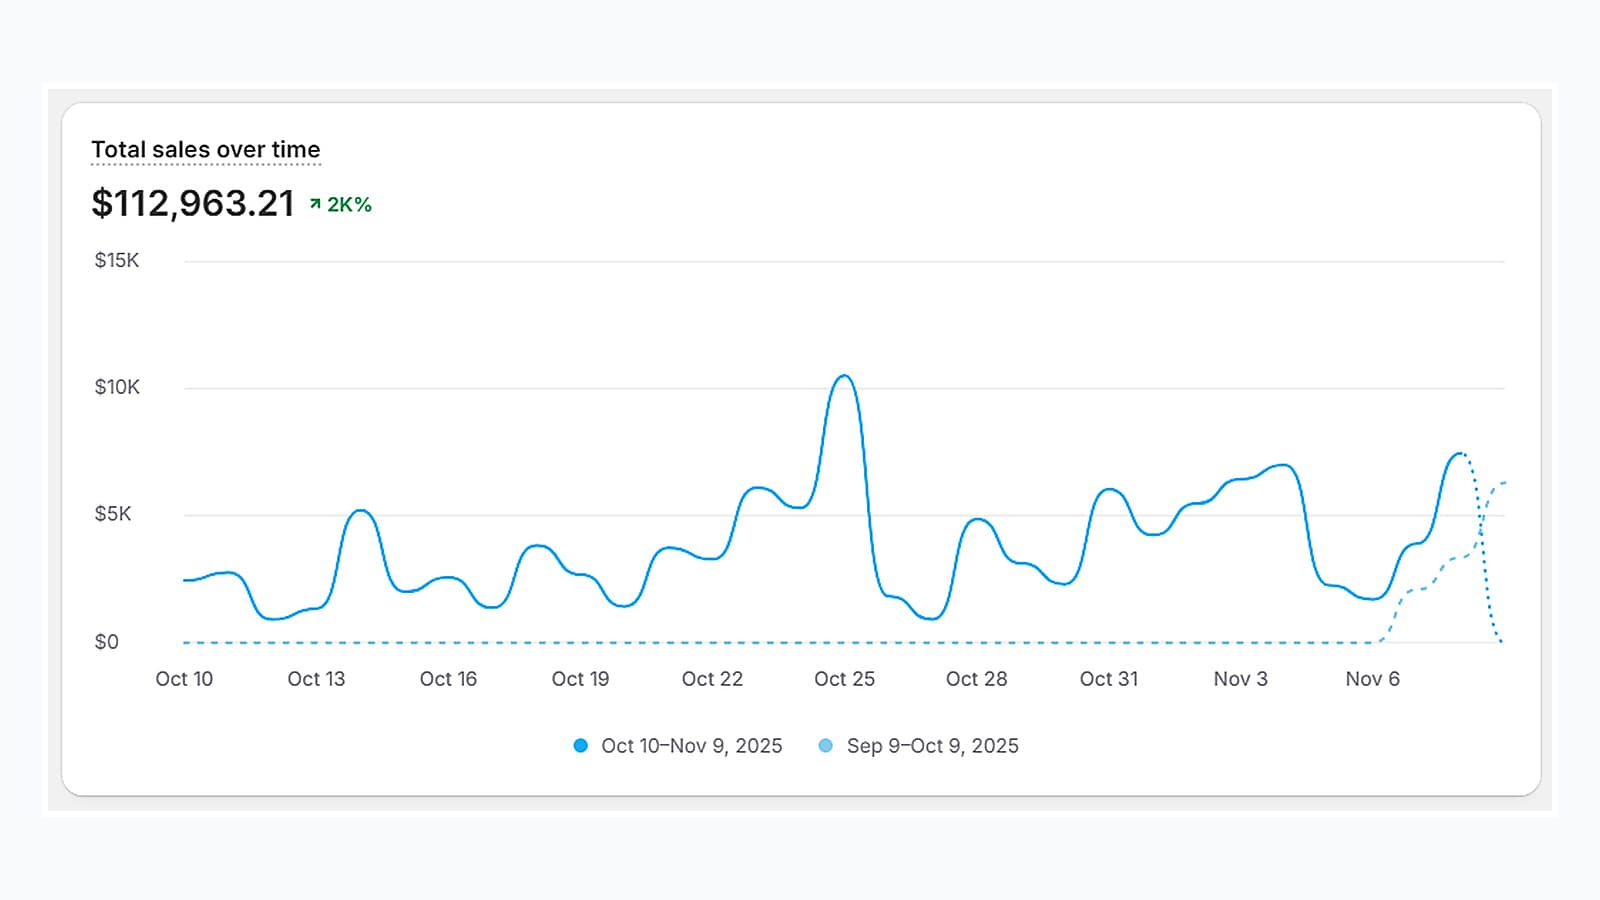
Sales trend against prior period
Daily sales across the window. Percentage badges are not published, because the prior month was near zero.
Our role
What we did, and what the client did
CodeActivator ran strategy, advertising, creative production and the website fixes. The client handled fulfilment and customer service.
Tools used
- Shopify
- Meta Ads Manager
- Google Ads
Client feedback
What the client said
We publish feedback only with written permission.
[Add Approved Testimonial]. No approved quote has been provided for this project yet, so nothing is shown here.
Related work
Other projects you may want to see
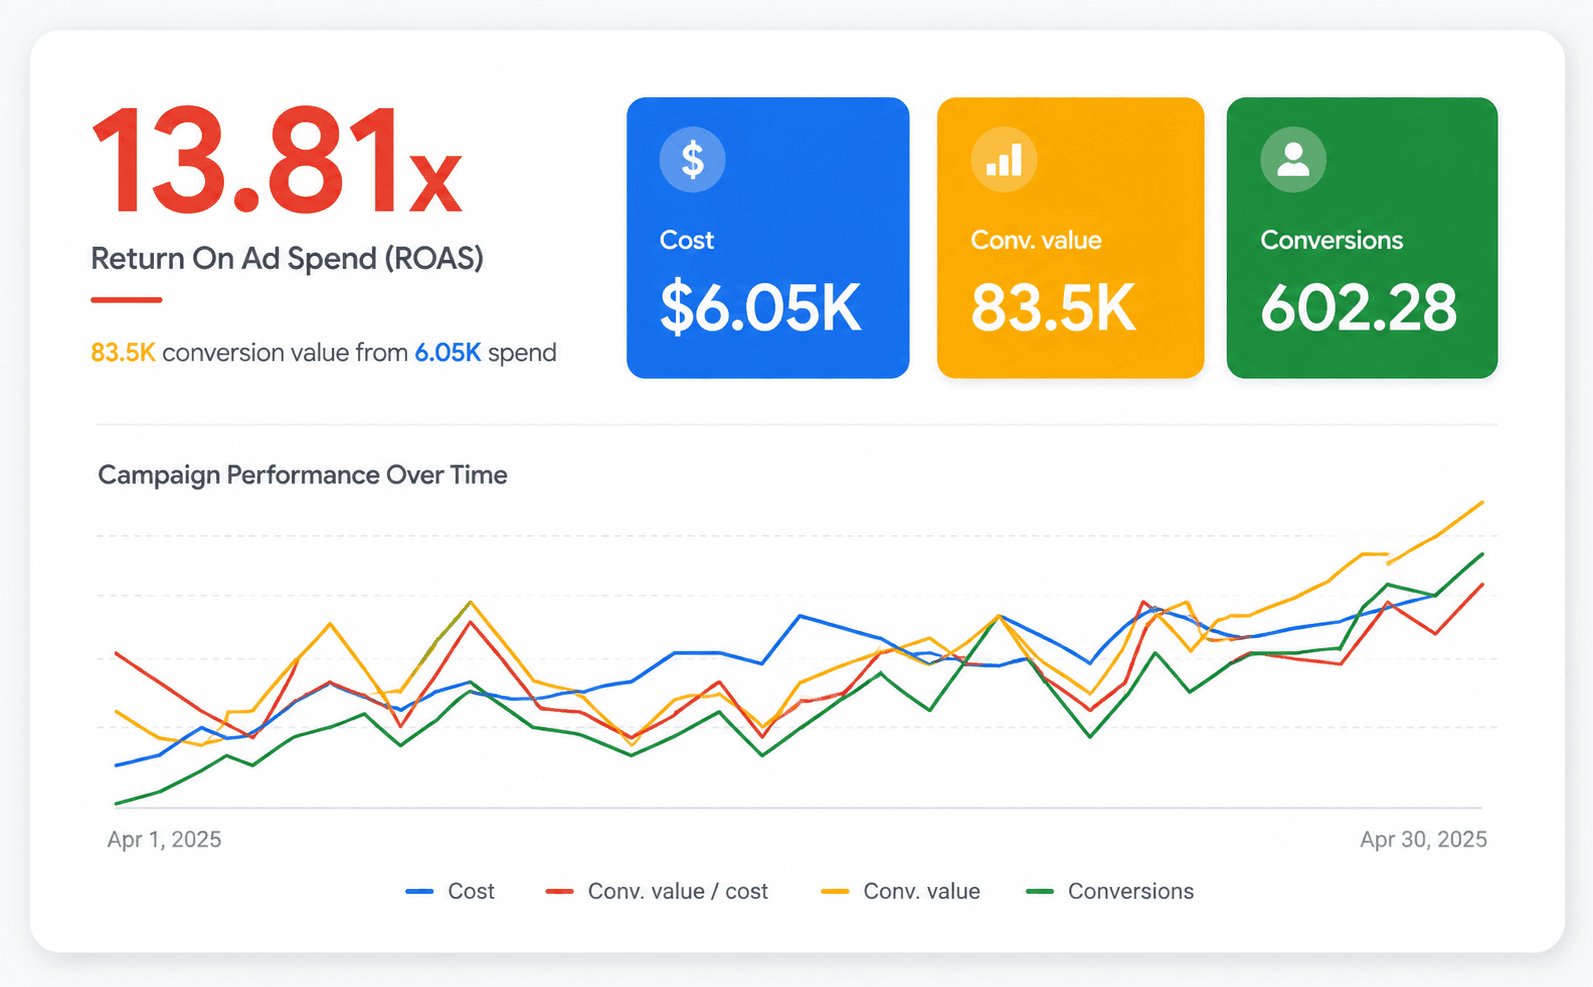
Paid Advertising Project
E-commerce retailer · name withheld under NDA
Challenge
The store was already running Google Ads and wanted to spend more, but only if return held. Existing campaigns needed updated structure before extra budget could be trusted to perform.
Result
Return held above 13x while spend scaled 52%
SEO Growth Project
Pest control services company · name withheld under NDA
Challenge
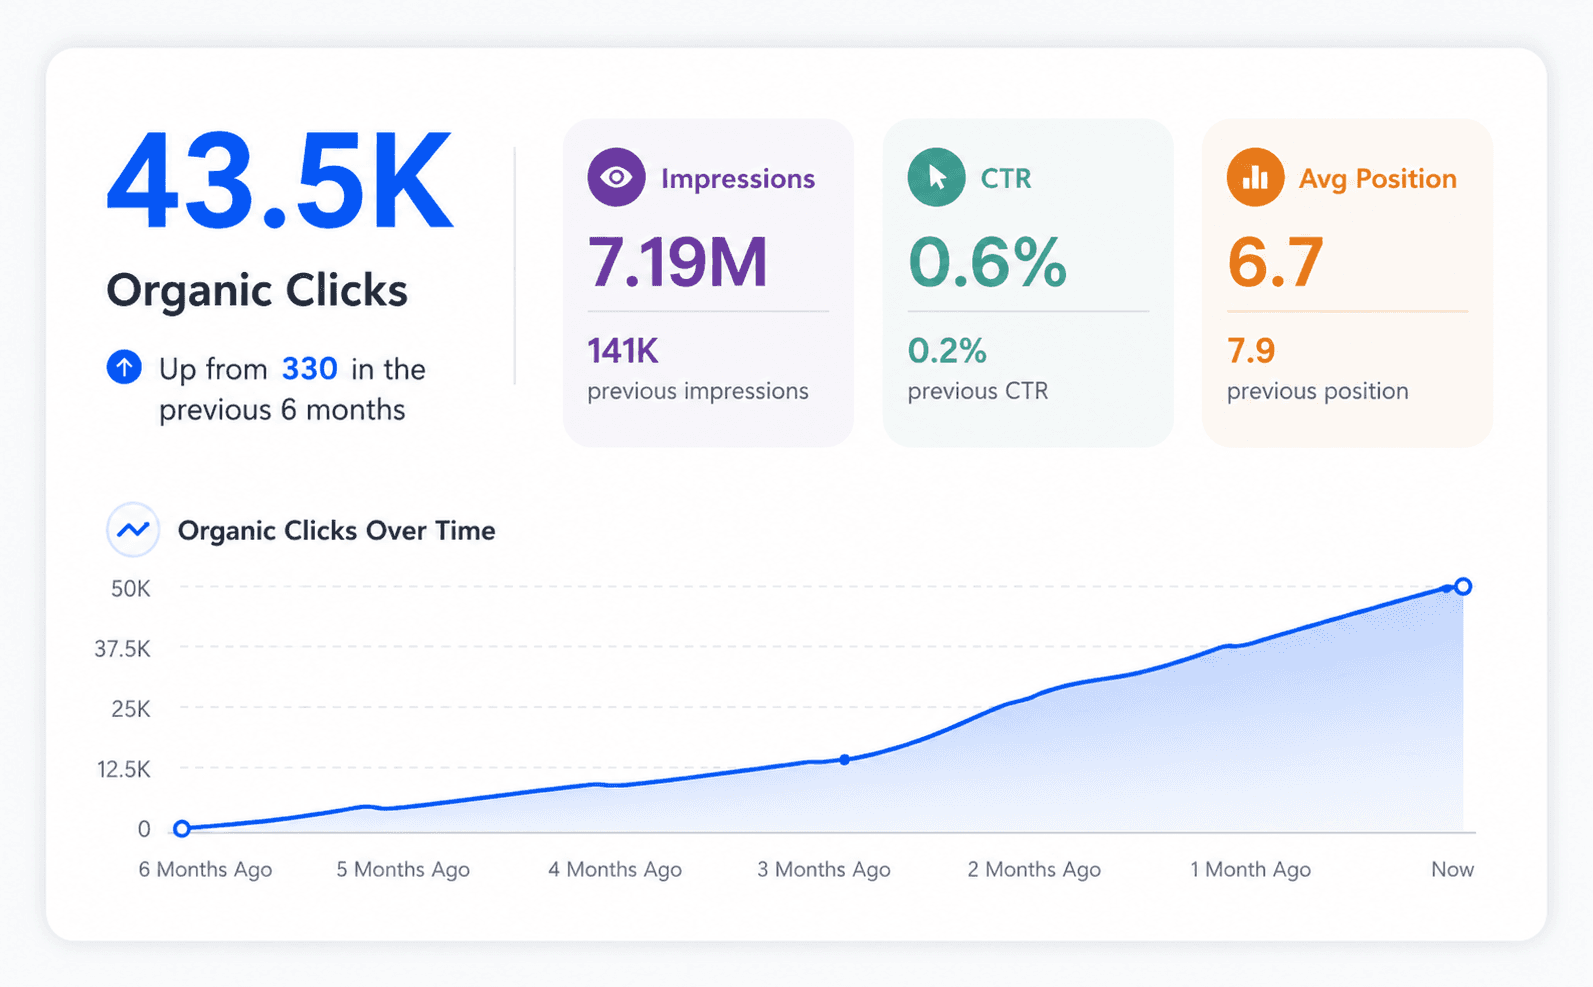
The company had an established website that search engines had known about for years, yet it produced almost no business. Across a full six month window the site earned 330 organic clicks. Service pages were thin, the questions homeowners actually search before hiring pest control were not covered anywhere on the site, and average positions kept the site out of meaningful visibility.
Result
330 to 43,500 organic clicks in six months
Need Similar Results? Let's Discuss Your Project
Tell us what you are trying to improve. We will tell you what we would do first, and whether we are the right team for it.